Midjourney
Copy the prompt or code, then paste it after your own words in Midjourney. How it works →
About
Climate history graph is a visual representation of climate data, often used to illustrate changes in temperature, carbon dioxide levels, and other environmental factors over time. These graphs are crucial for understanding the historical context of climate change and its impact on the planet.
Observations
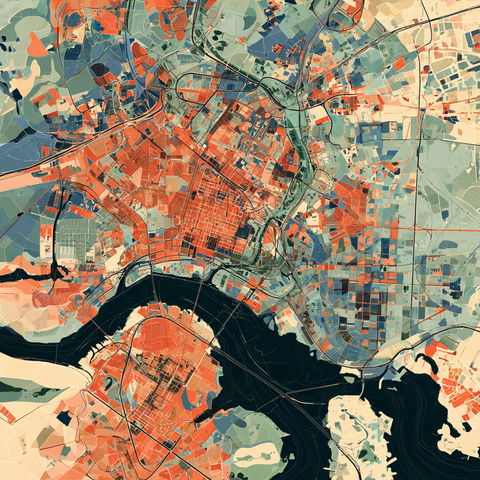
The style combines expressive, multicolored data plots with geometric grid structures, layered waveform lines, and sharply rising spectral forms. It shifts between dark, saturated chart fields and warm aged-paper surfaces, with visible grain and a tactile, retro infographic quality.
Look terms
Style qualityAbstract804Detailed8,113Expressive3,403
SubjectPatterns1,250
TechniqueGrain842
Colour schemeVivid5,436
ThemeRetro676
MediumCollage313
CompositionGeometric2,386
Colours
Earlier versions
Similar styles

Techniques




SREF codes

Designers