Save and like styles with a free account. A membership adds notes and more room. See membership →
Copy the prompt or code, then paste it after your own words in Midjourney. How it works →
About
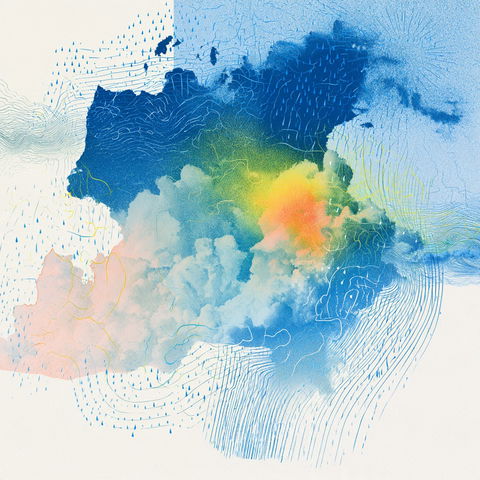
Contour plot is a graphical representation used to show the three-dimensional surface on a two-dimensional plane, often used in mathematics and engineering to display levels of elevation or depth. It uses lines to connect points of equal value, creating a map-like visualization that can represent various data sets.
Observations
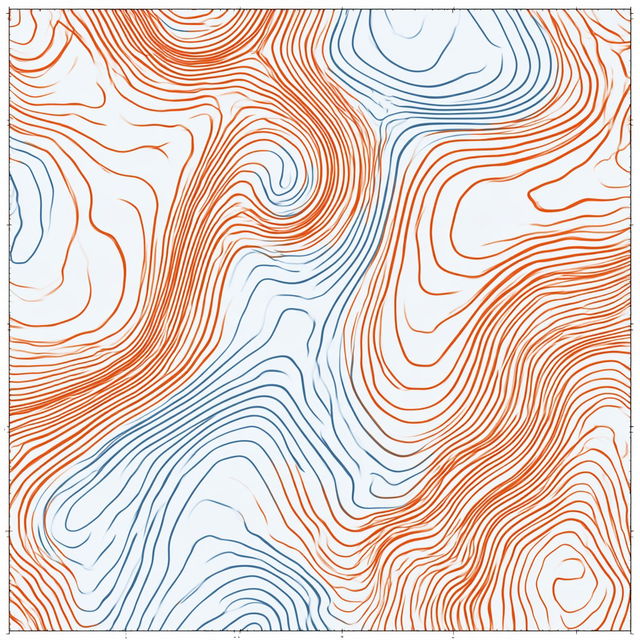
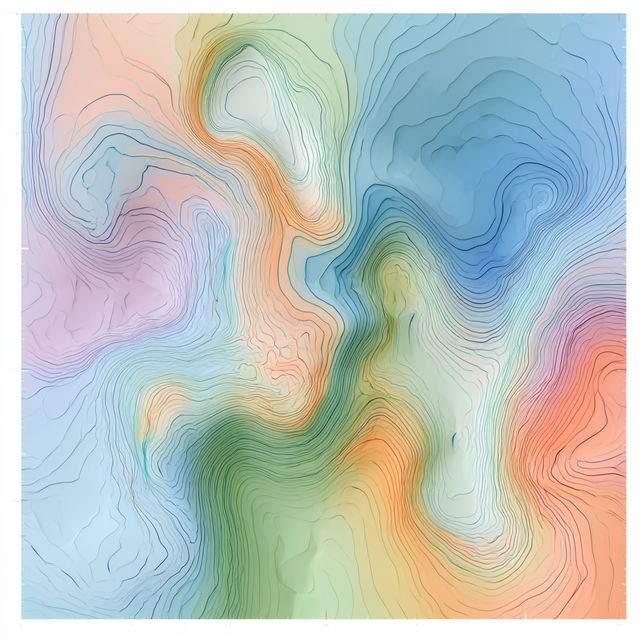
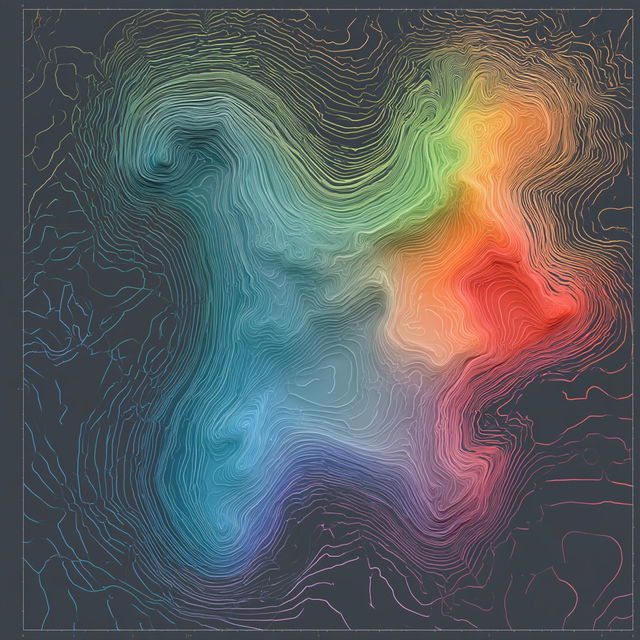
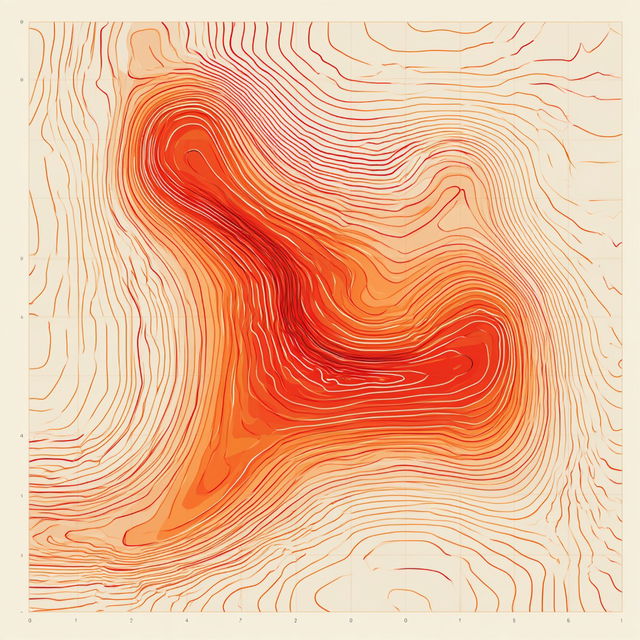
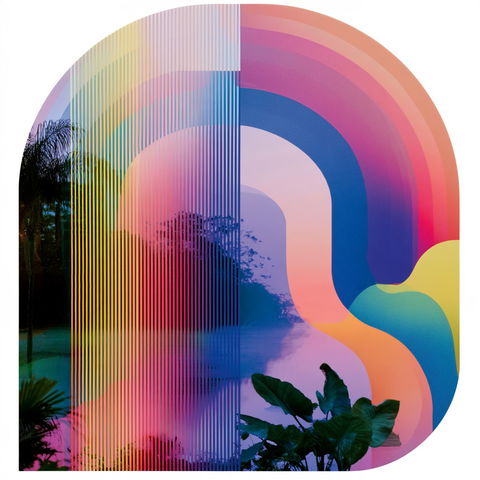
Across all four renders, the style uses dense, fine contour lines that flow into swirling, topographic abstractions. Clean graphic linework overlays broad color fields, shifting between pale backgrounds and dark grounds with saturated orange, blue, green, and coral accents, creating a kinetic, map-like surreal effect.
Look terms
Style qualityAbstract804Detailed8,113Illustrative2,985
SubjectPatterns1,250
Visual effectsGlow2,290Motion1,525
TechniqueFine lines2,687Flat color2,068
Colour schemeVivid5,436
GenreSurreal3,262
CompositionGeometric2,386
Colours
Earlier versions
Similar styles


Techniques
Techniques
SREF codes

SREF codes
Techniques