Four quick questions — which AI tools you use, and what we should build next.help us choose.

Take the poll →
Techniques

Electromagnetic spectrum chart

Scientific data visualization

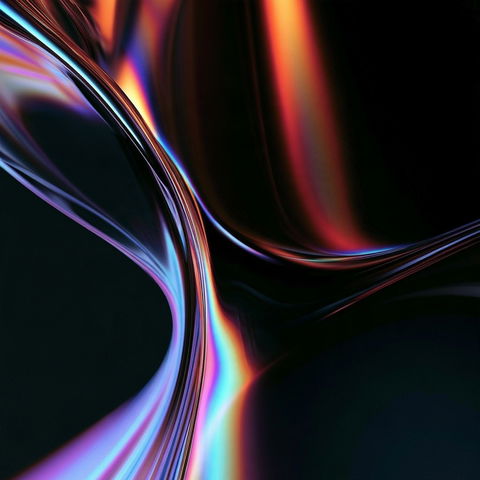
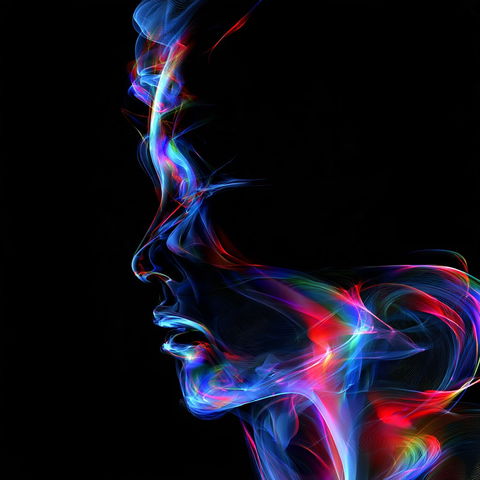
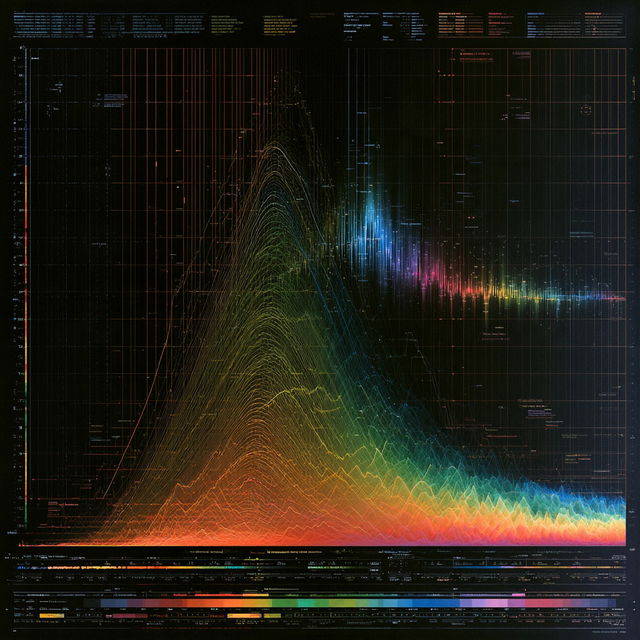
Electromagnetic spectrum chart style, Midjourney V8.2, render 1 of 4
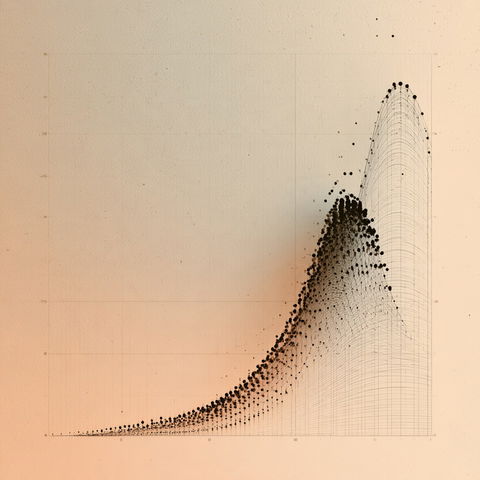
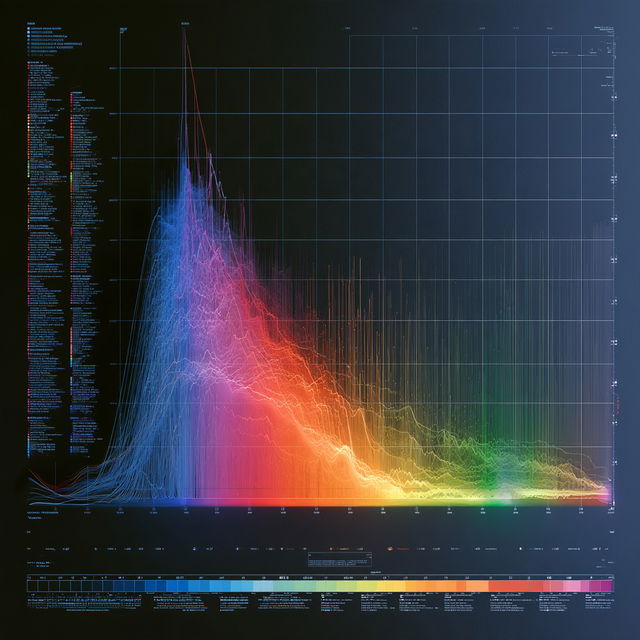
Electromagnetic spectrum chart style, Midjourney V8.2, render 2 of 4
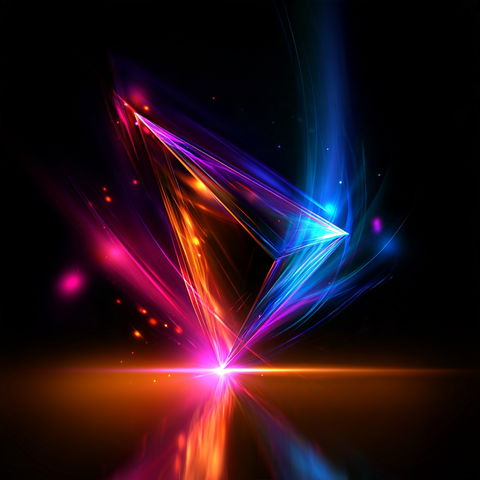
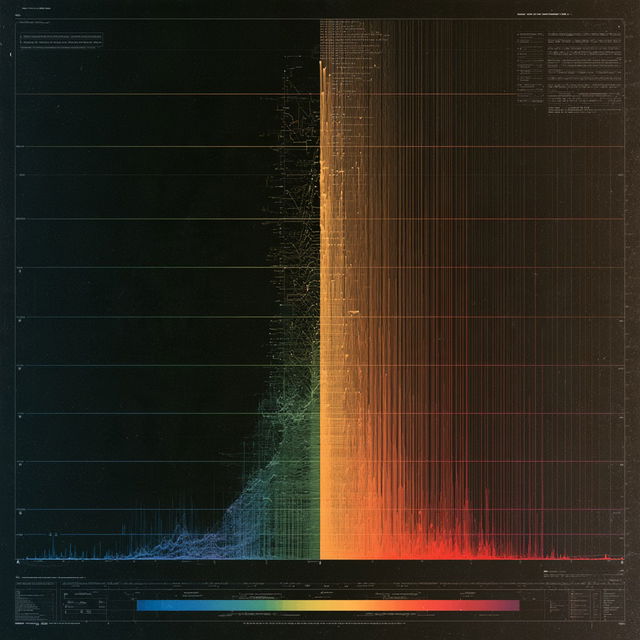
Electromagnetic spectrum chart style, Midjourney V8.2, render 3 of 4
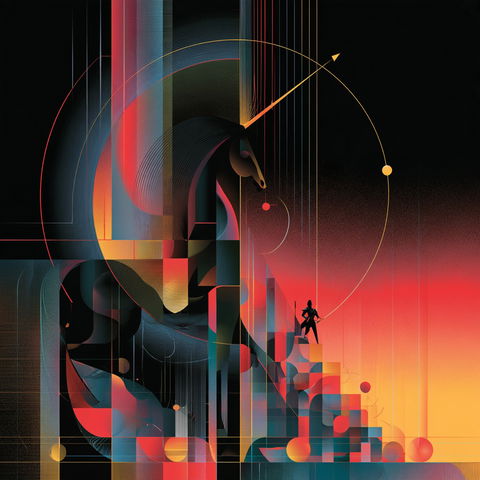
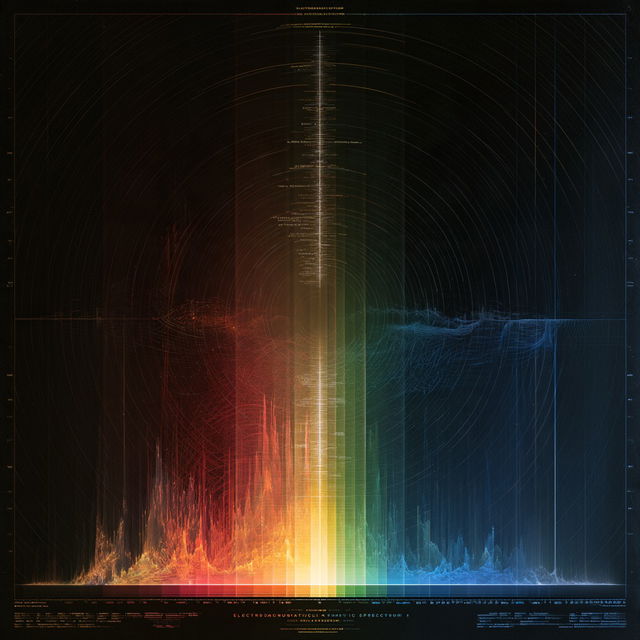
Electromagnetic spectrum chart style, Midjourney V8.2, render 4 of 4

Save and like styles with a free account. A membership adds notes and more room. See membership →

Copy the prompt or code, then paste it after your own words in Midjourney. How it works →

About

Electromagnetic spectrum chart is a visual representation of the range of all types of electromagnetic radiation. It includes visible light, radio waves, microwaves, infrared, ultraviolet, X-rays, and gamma rays, each with varying wavelengths and frequencies. This chart is used in scientific fields to illustrate the different types of electromagnetic waves and their applications.

Observations

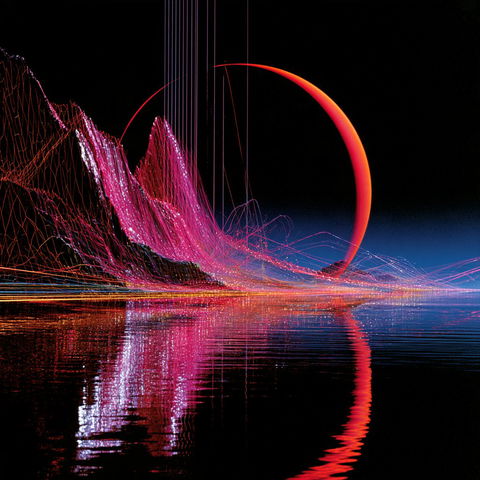
Across all four renders, the style presents dense abstract data visualizations on near-black grounds, combining precise grids, fine technical lines, annotations, and waveform-like curves. Saturated spectral colors, luminous traces, strong dark-to-bright contrast, and structured scientific interfaces give the imagery a futuristic instrumentation aesthetic.
Look terms

Colours

Earlier versions

Similar styles

Gridloom Signalworks style (SREF codes), Midjourney V8.2
Chromaflux style (SREF codes), Midjourney V8.2
SREF codes
Statistical graph style (Techniques), Midjourney V8.2
Ringsurge style (SREF codes), Midjourney V8.2
SREF codes
Penumbracircuit style (SREF codes), Midjourney V8.2
SREF codes
Prismfluidics style (SREF codes), Midjourney V8.2
SREF codes