Save and like styles with a free account. A membership adds notes and more room. See membership →
Copy the prompt or code, then paste it after your own words in Midjourney. How it works →
About
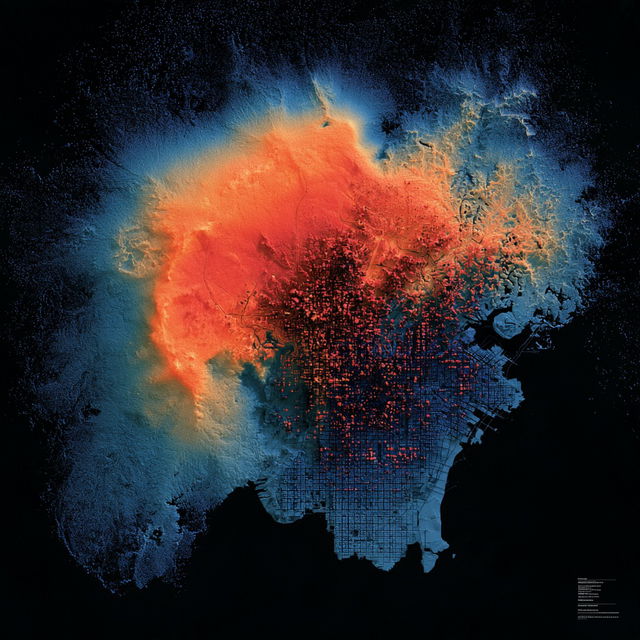
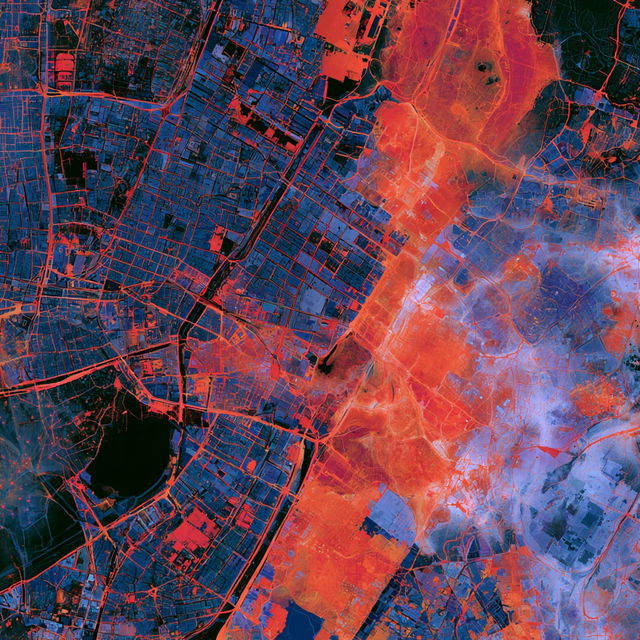
Heat map is a graphical representation of data where individual values are represented by colors. It is commonly used in various fields such as meteorology, biology, and business analytics to visualize complex data sets and identify patterns, trends, and anomalies.
Observations
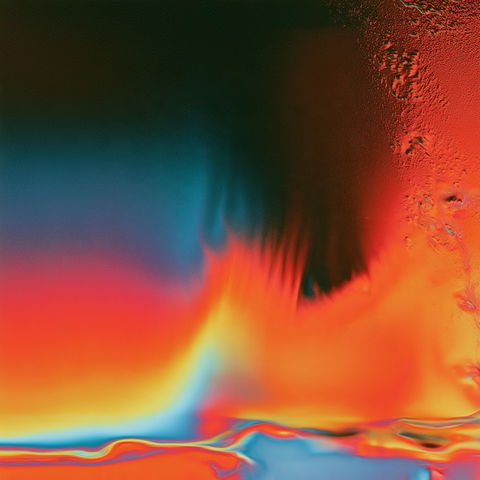
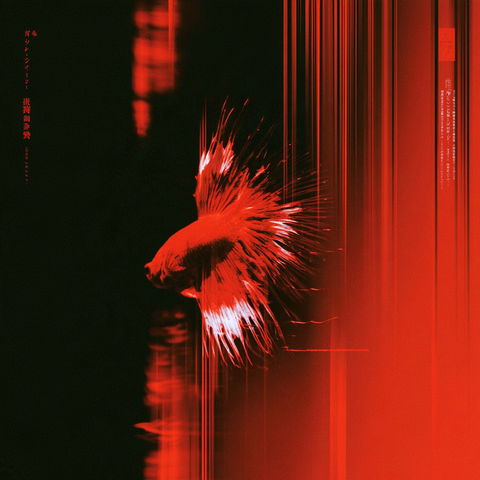
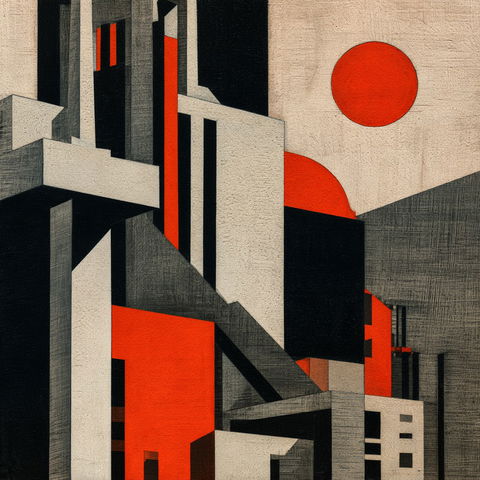
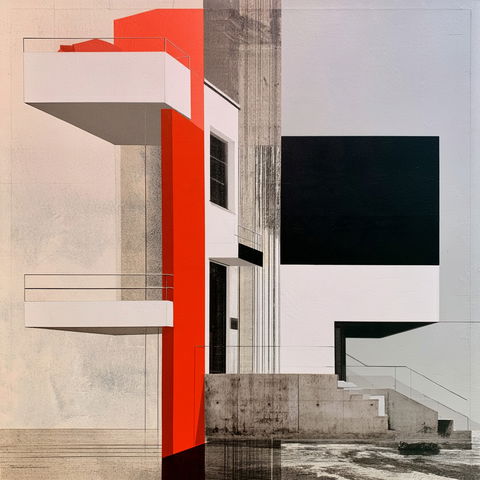
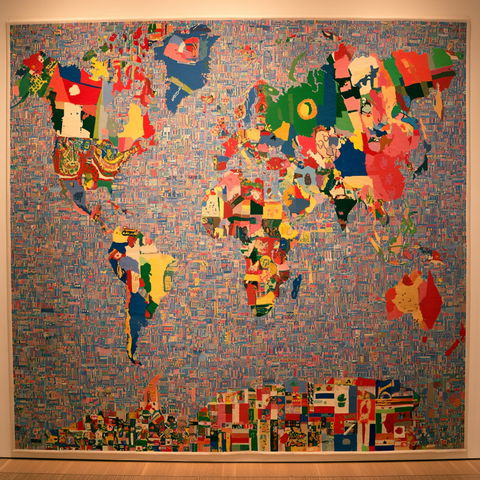
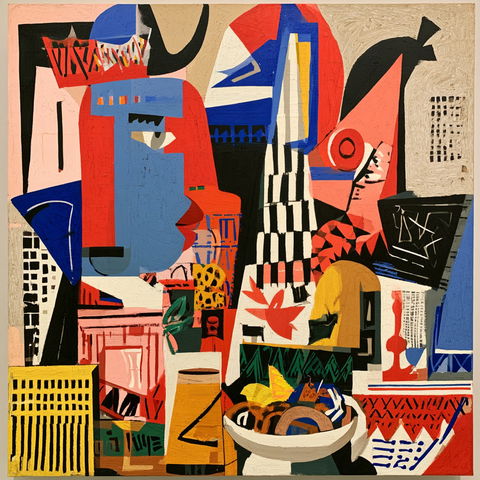
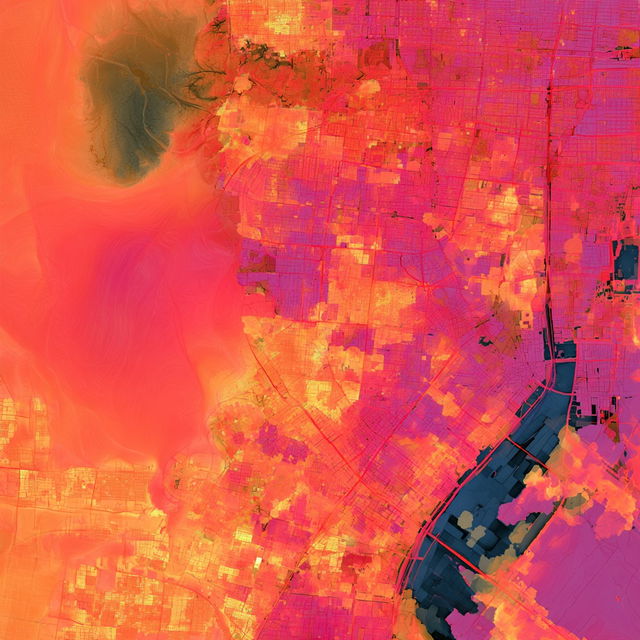
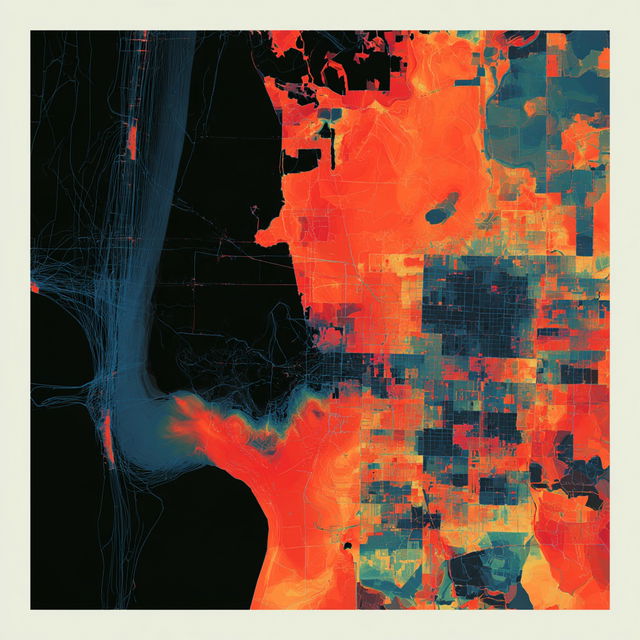
Across all four renders, dense urban-grid and map-like structures are transformed into abstract compositions of sharply divided color fields, fine linear networks, and irregular layered fragments. Saturated orange, blue, magenta, and red dominate against deep black areas, combining graphic flatness with expressive, smeared textures and a surreal cartographic effect.
Look terms
Style qualityAbstract804Expressive3,403
SubjectPatterns1,250Urban1,373
TechniqueFine lines2,687Flat color2,068
Colour schemeHigh contrast5,516Vivid5,436
GenreSurreal3,262
MediumCollage313
CompositionGeometric2,386