Copy the prompt or code, then paste it after your own words in Midjourney. How it works →
About
Phase diagram is a graphical representation used in thermodynamics and physical chemistry to show the conditions of pressure, temperature, and volume under which distinct phases occur and coexist at equilibrium. It is a crucial tool for understanding the properties of substances and their transitions between solid, liquid, and gas phases.
Observations
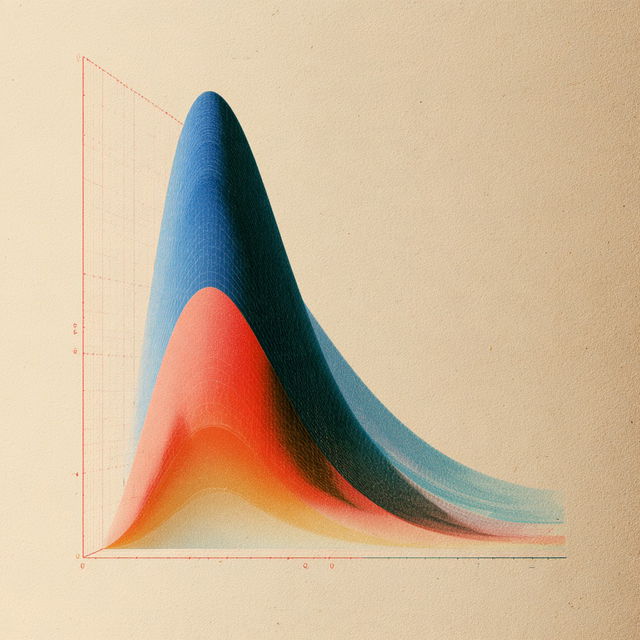
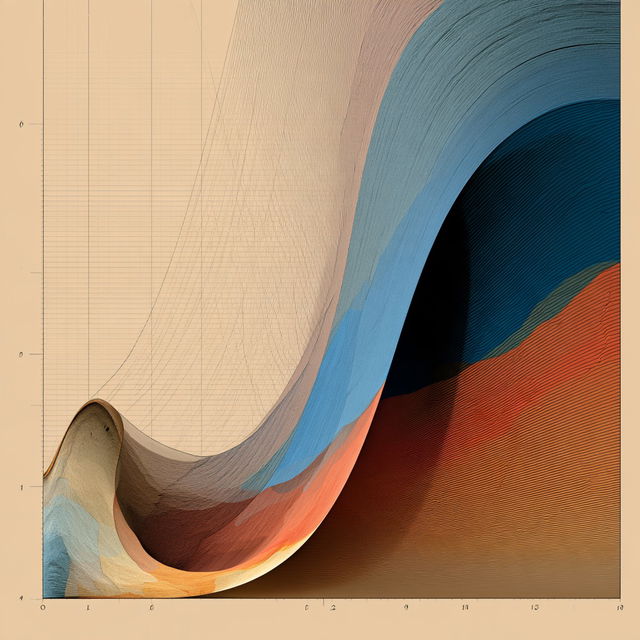
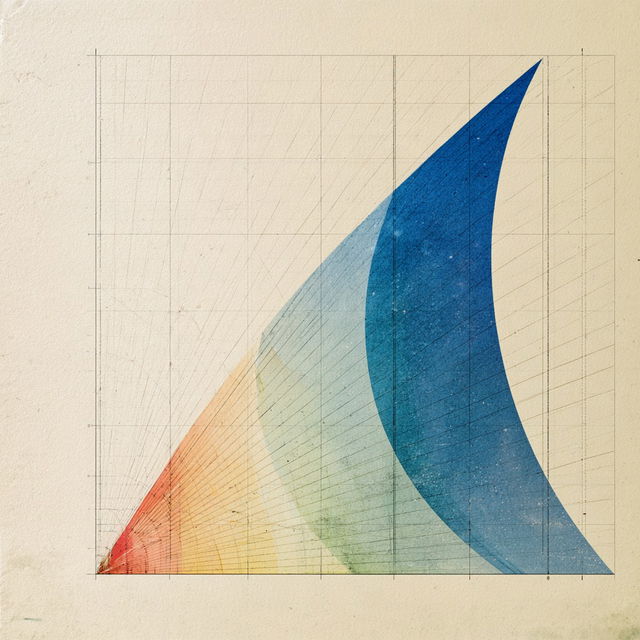
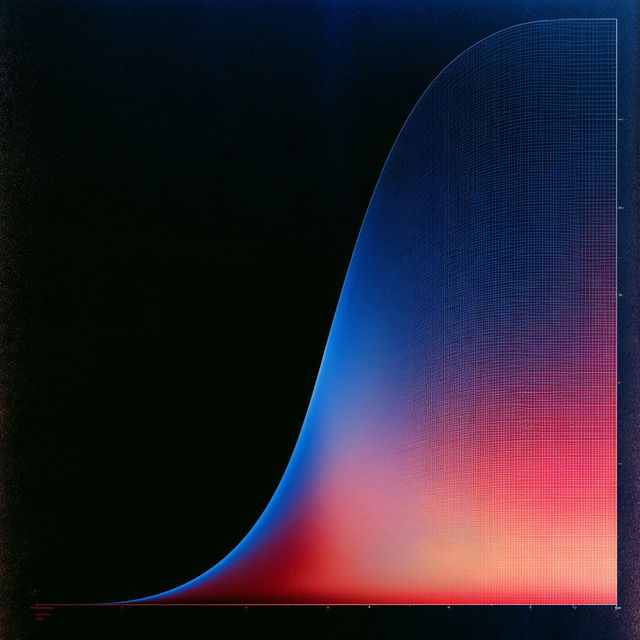
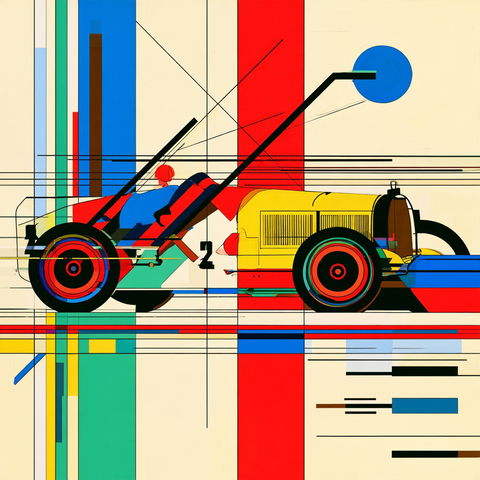
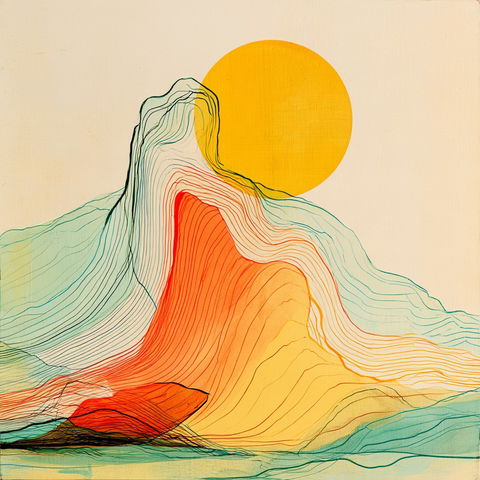
The style combines abstract, sweeping geometric forms with mathematical graph-paper scaffolding and densely repeated fine contour lines. Saturated blue, coral, and red bands contrast with cream or deep navy grounds, while grain and print-like texture soften the otherwise clean illustrative shapes.
Look terms
Style qualityAbstract804Bold1,079Detailed8,113Illustrative2,985
SubjectPatterns1,250
Colour schemeVivid5,436
MediumDrawing1,746
CompositionGeometric2,386Negative space1,403
Colours
Earlier versions
Similar styles


SREF codes

SREF codes

SREF codes
SREF codes

SREF codes