Save and like styles with a free account. A membership adds notes and more room. See membership →
Copy the prompt or code, then paste it after your own words in Midjourney. How it works →
About
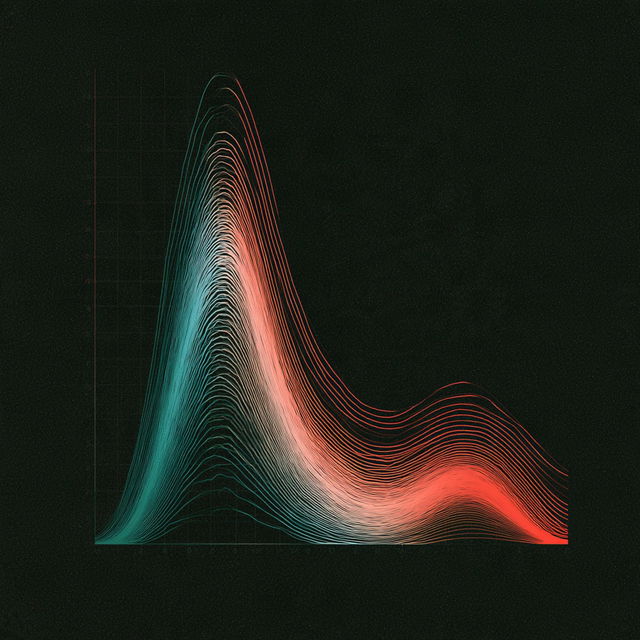
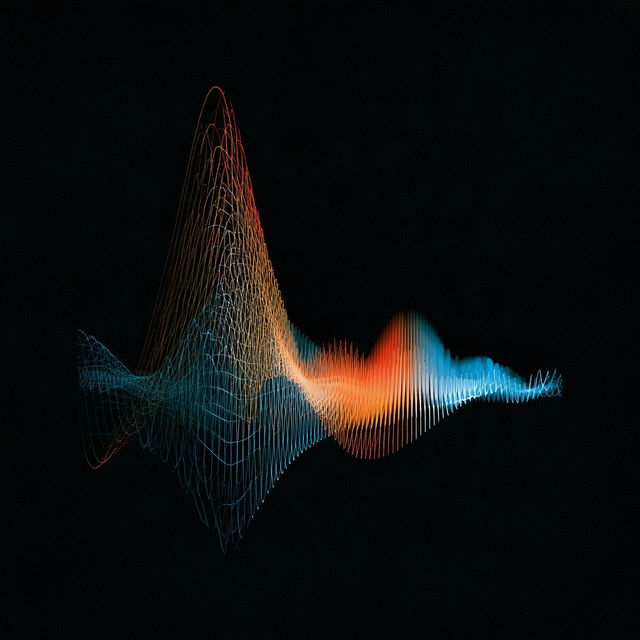
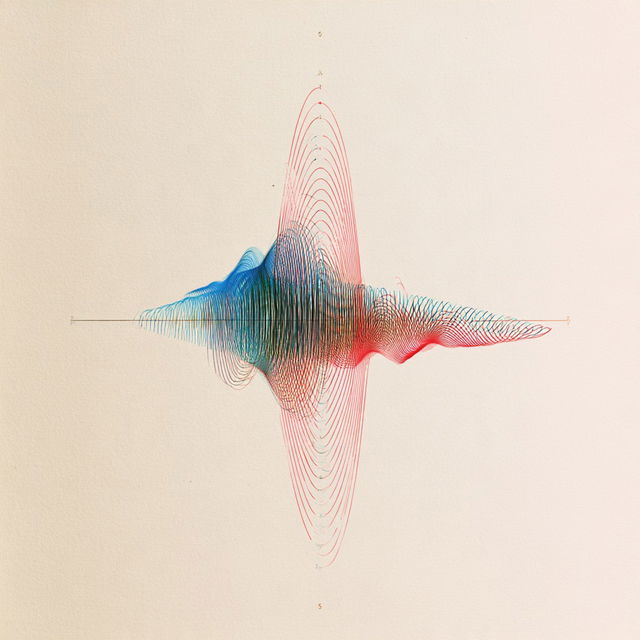
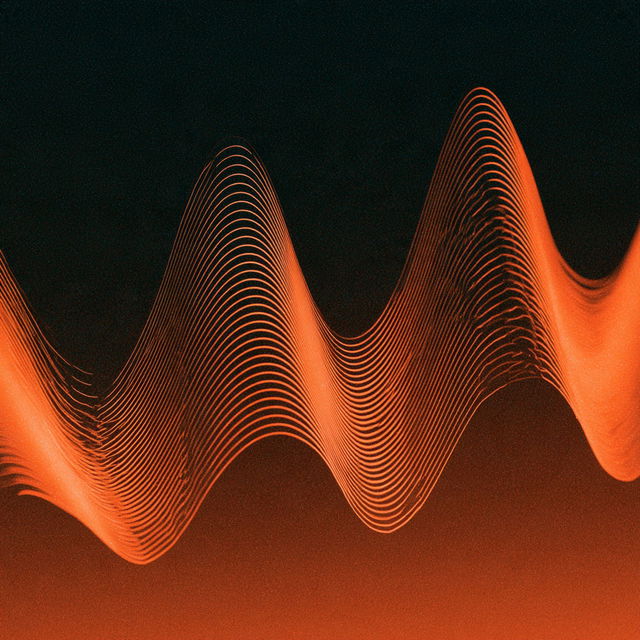
Sound wave diagram is a visual representation of sound waves, illustrating the amplitude and frequency of sound over time. These diagrams are commonly used in audio engineering, acoustics, and music production to analyze sound characteristics and patterns.
Observations
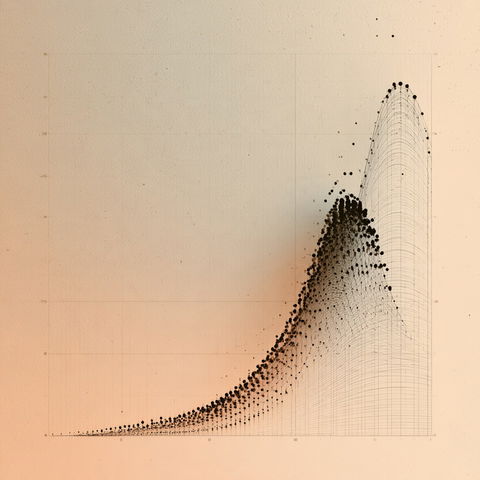
The style uses precise, fine-lined waveform structures and repeated contour curves to turn abstract data-like forms into flowing visual compositions. Strong cyan, orange, red, and blue accents contrast with black or cream grounds, while subtle grain and luminous color give the clean geometric linework a tactile, poster-like presence.
Look terms
Style qualityAbstract804Illustrative2,985
SubjectPatterns1,250
Visual effectsGlow2,290Motion1,525
Colour schemeHigh contrast5,516Vivid5,436
MediumDrawing1,746
CompositionGeometric2,386