Save and like styles with a free account. A membership adds notes and more room. See membership →
About
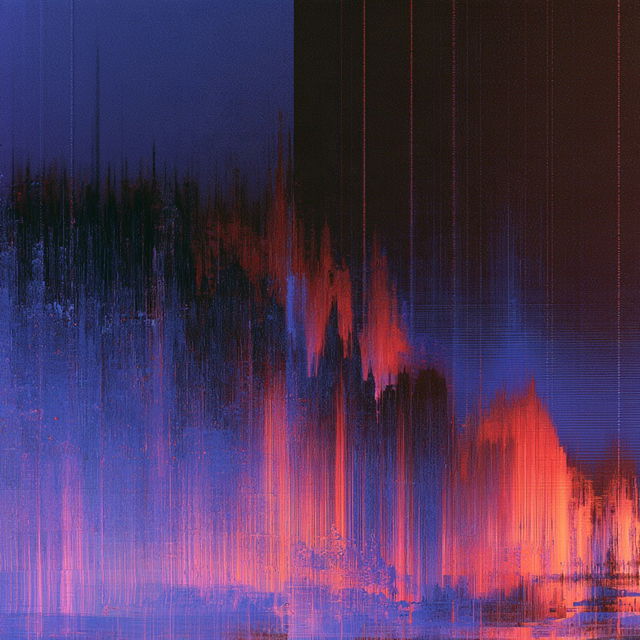
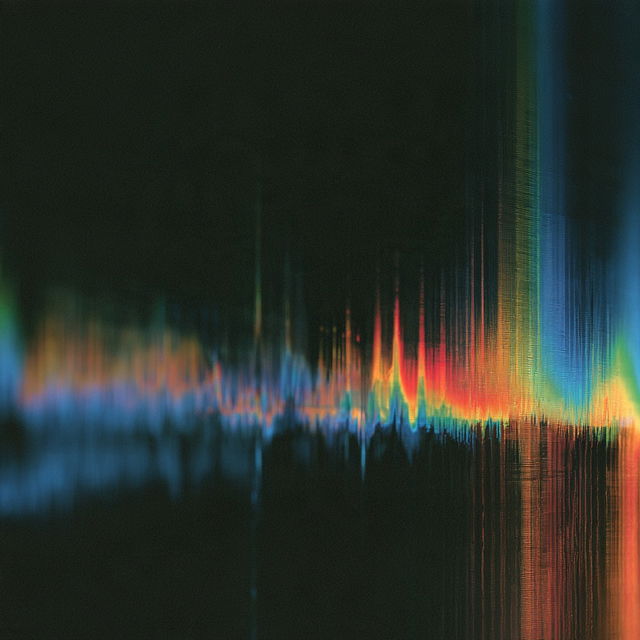
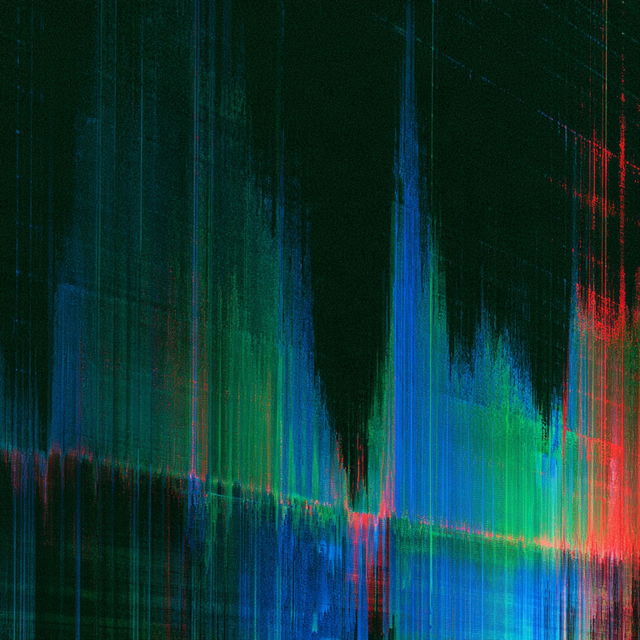
Spectrogram is a visual representation of the spectrum of frequencies in a sound signal as they vary with time. It is commonly used in audio analysis, music production, and various scientific fields to analyze the frequency content of signals. Spectrograms display time on one axis and frequency on another, with color or intensity representing the amplitude of a particular frequency at a given time.
Observations
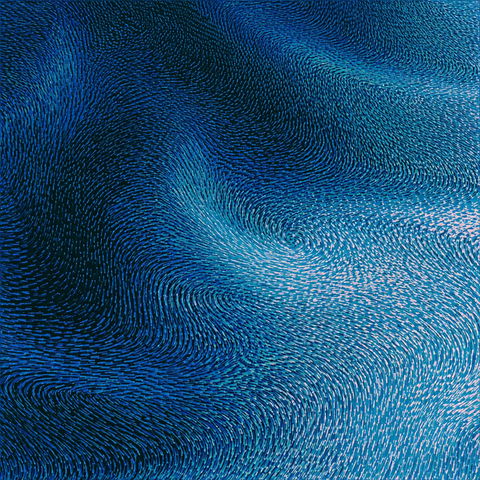
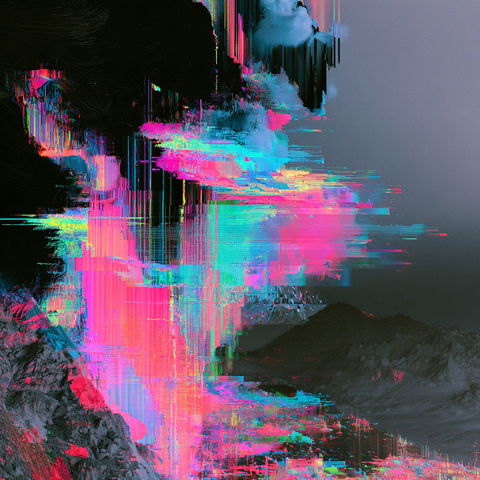
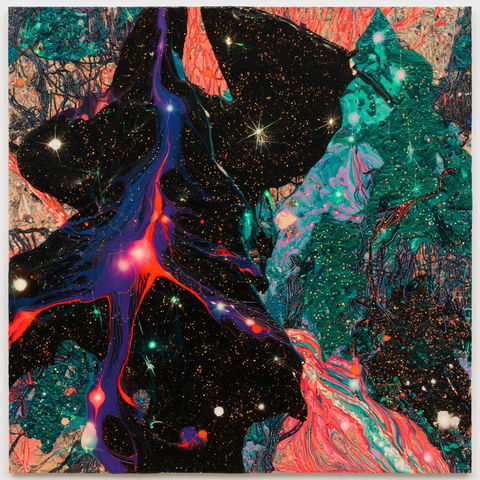
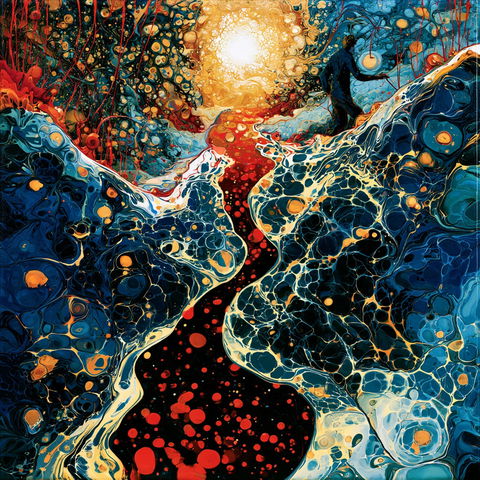
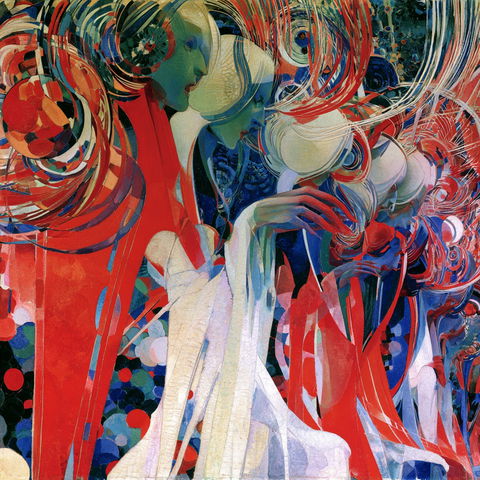
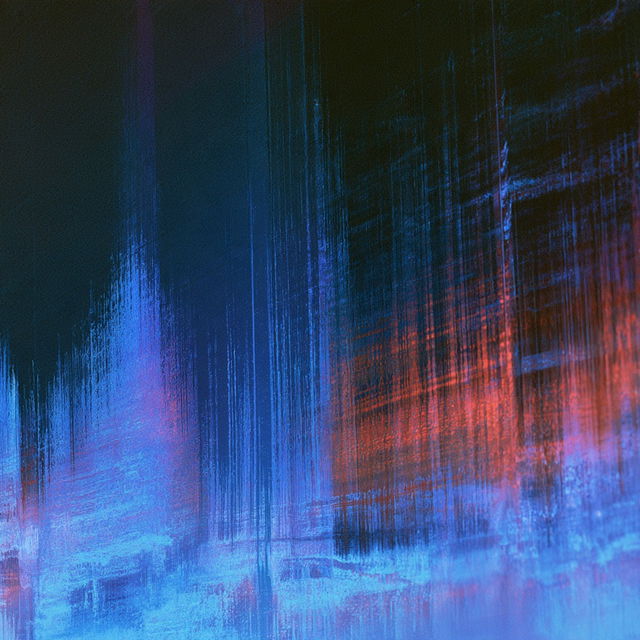
Across all four renders, saturated neon color bands and vertical streaks dissolve recognizable forms into abstract, waveform-like compositions. Broad directional marks, luminous passages, dark negative fields, and glitch-like interference create a kinetic, surreal visual language.