Copy the prompt or code, then paste it after your own words in Midjourney. How it works →
About
Data visualization is a graphical representation of information and data, using visual elements like charts, graphs, and maps to provide an accessible way to see and understand trends, outliers, and patterns in data.
Observations
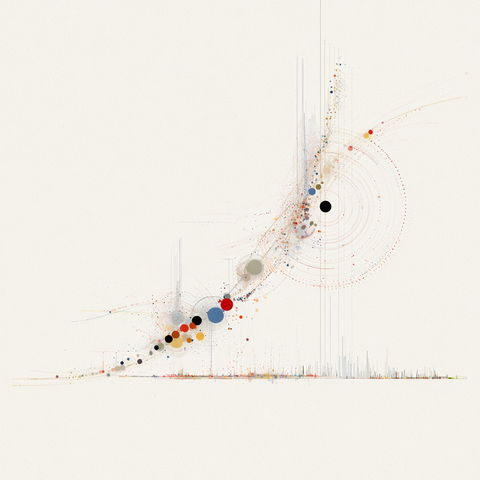
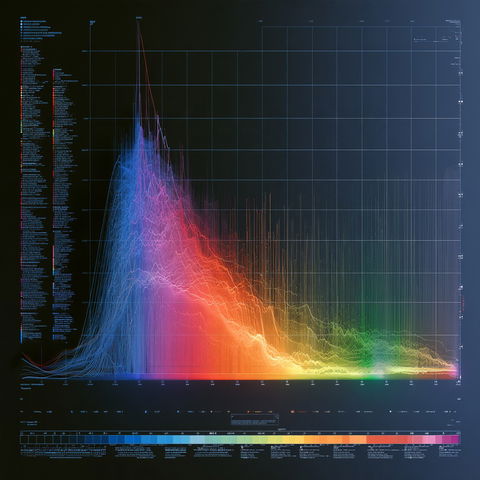
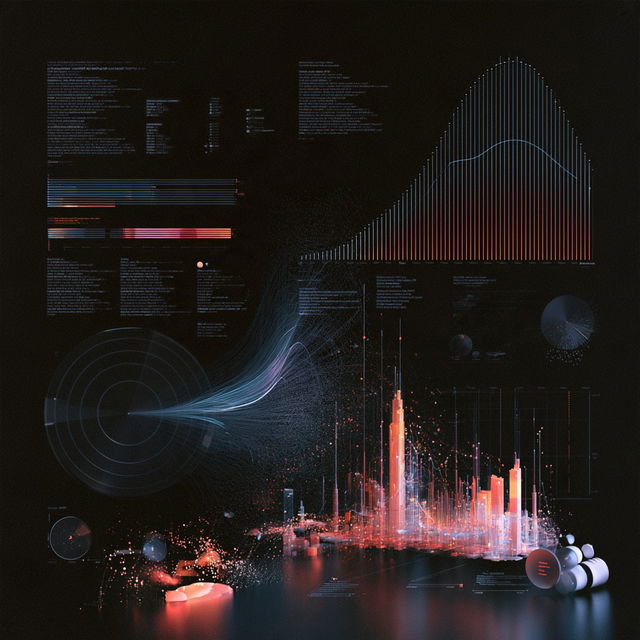
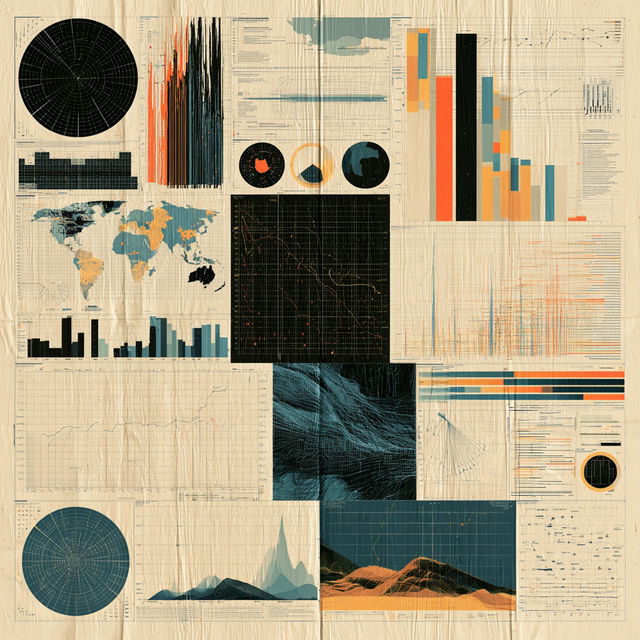
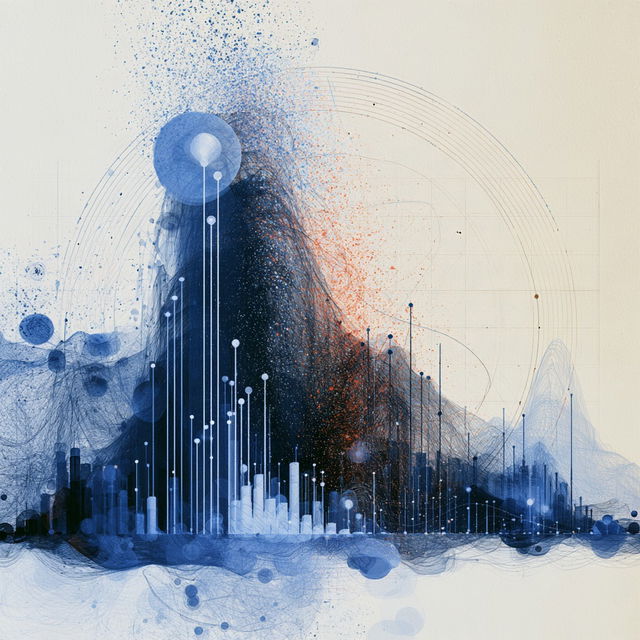
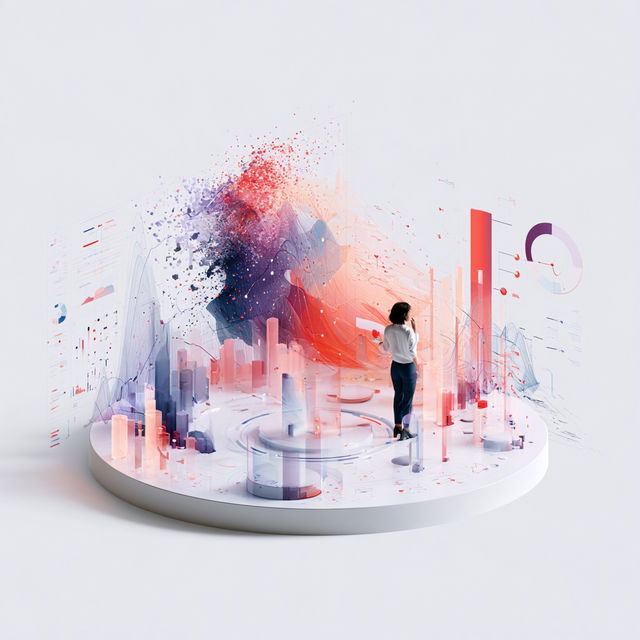
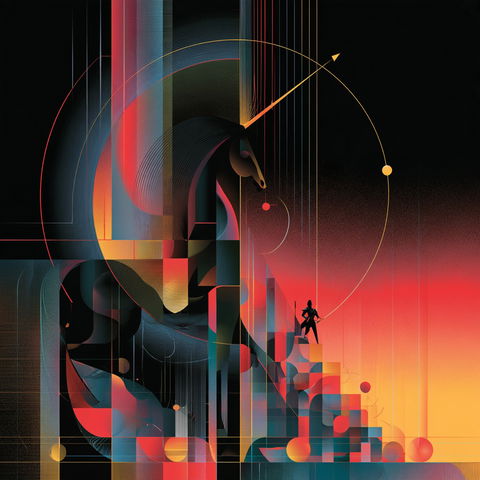
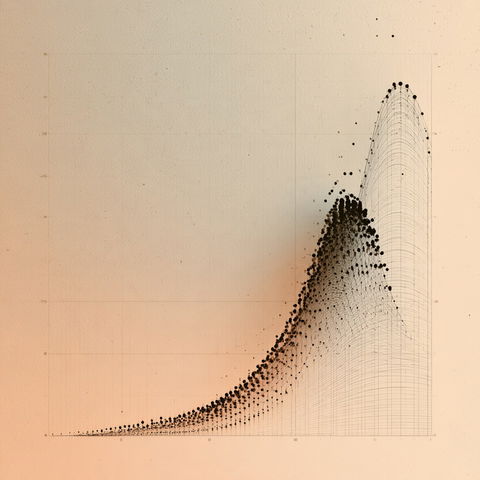
The style combines dense data-visualization geometry with expressive flowing marks, particle sprays, diagrams, grids, and architectural forms. It shifts between dark luminous digital compositions and pale editorial infographic layouts, using vivid blue, coral, orange, and teal accents, strong negative space, and layered linework throughout.
Look terms
SubjectPatterns1,250
Visual effectsGlow2,290Motion1,525
Colour schemeVivid5,436
CompositionGeometric2,386Negative space1,403
Colours
Earlier versions
Similar styles

SREF codes


SREF codes