Copy the prompt or code, then paste it after your own words in Midjourney. How it works →
About
Infographic is a visual representation of information or data, often used to present complex information quickly and clearly. It combines elements of design, writing, and analysis to convey data in a visually engaging way, often using charts, diagrams, and illustrations to make the information more accessible.
Observations
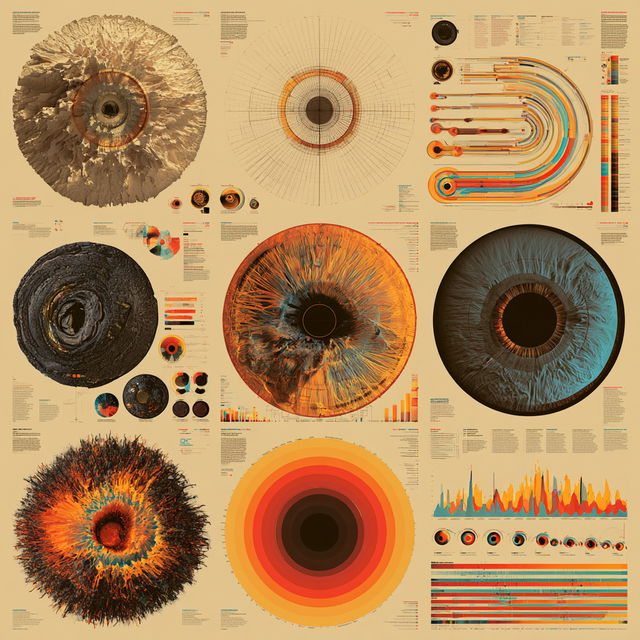
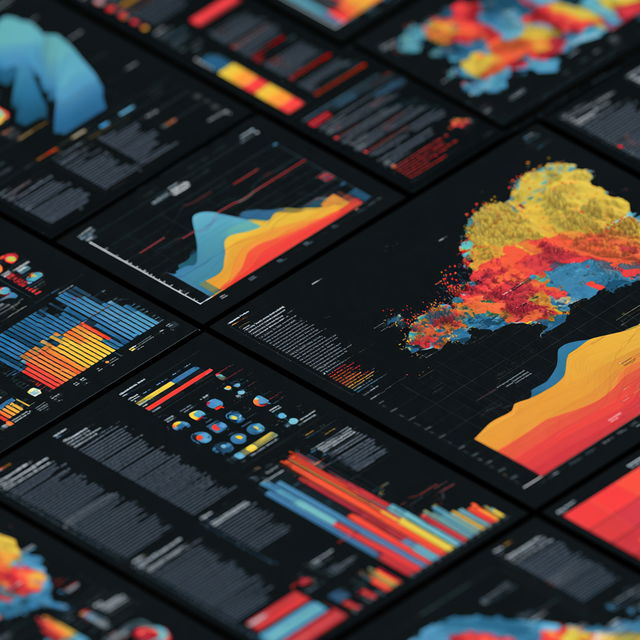
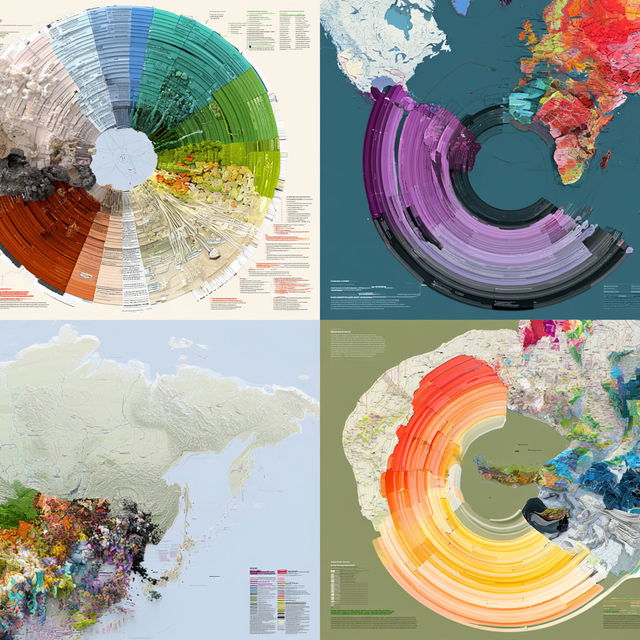
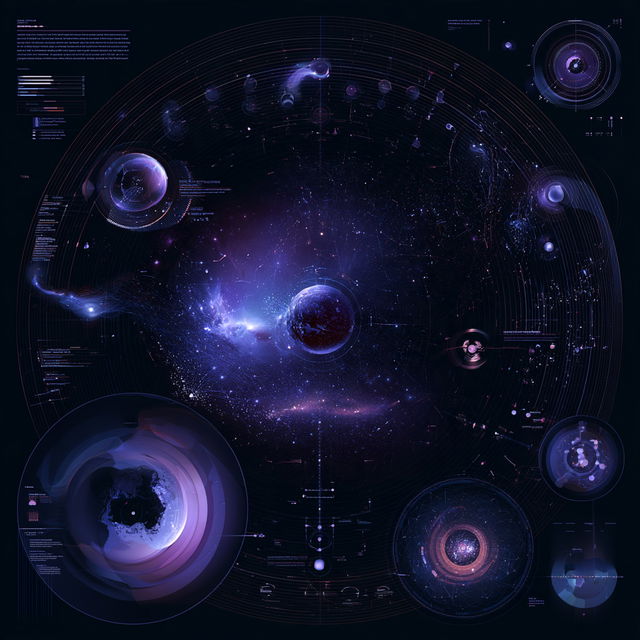
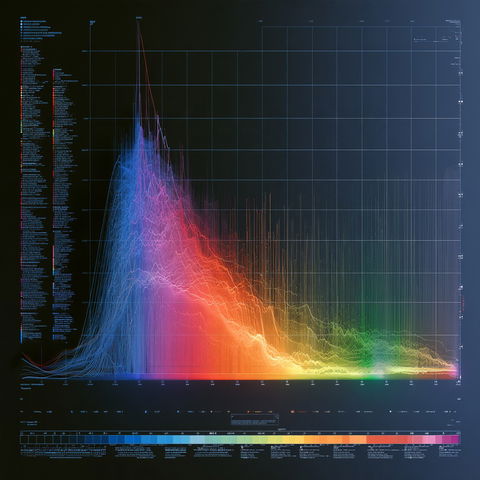
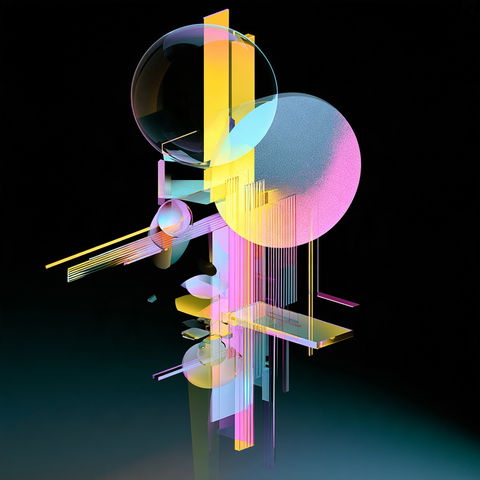
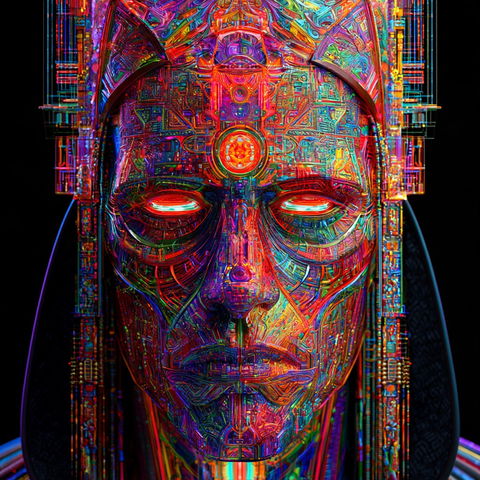
This style combines dense scientific-infographic layouts with abstract circular, radial, and map-like structures. Fine technical lines, tiny annotations, clean graphic shapes, and strongly color-coded accents create a precise data-dashboard feel, while dark panels and luminous purple or multicolored elements add a futuristic atmosphere.
Look terms
Style qualityAbstract804Detailed8,113Illustrative2,985Ornate1,627
SubjectPatterns1,250
Visual effectsGlow2,290
TechniqueFine lines2,687Flat color2,068
Colour schemeVivid5,436
GenreSci-fi587
CompositionGeometric2,386
Colours
Earlier versions
Applications
Featured in

Similar styles

SREF codes


SREF codes

SREF codes