

Copy the prompt or code, then paste it after your own words in Midjourney. How it works →
About
Statistical graph is a visual representation of data, used to convey quantitative information clearly and efficiently. It includes various types such as bar charts, line graphs, and pie charts, each serving different purposes in data analysis and presentation.
Observations
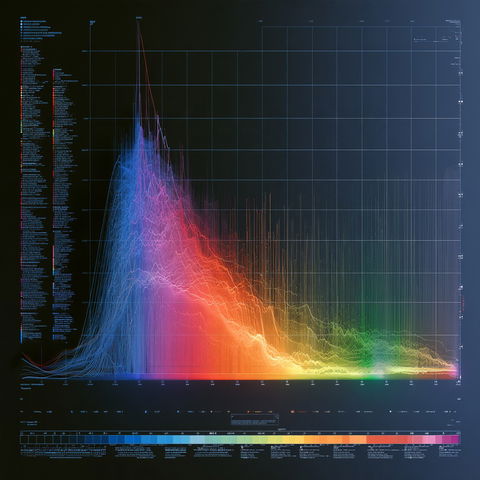
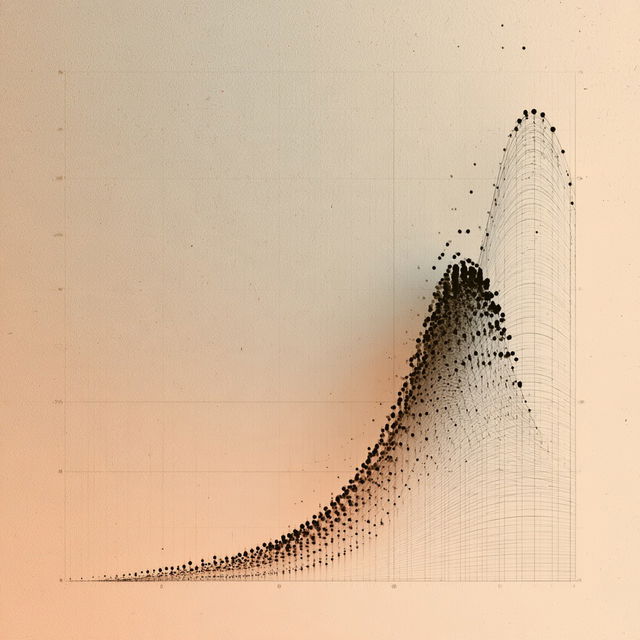
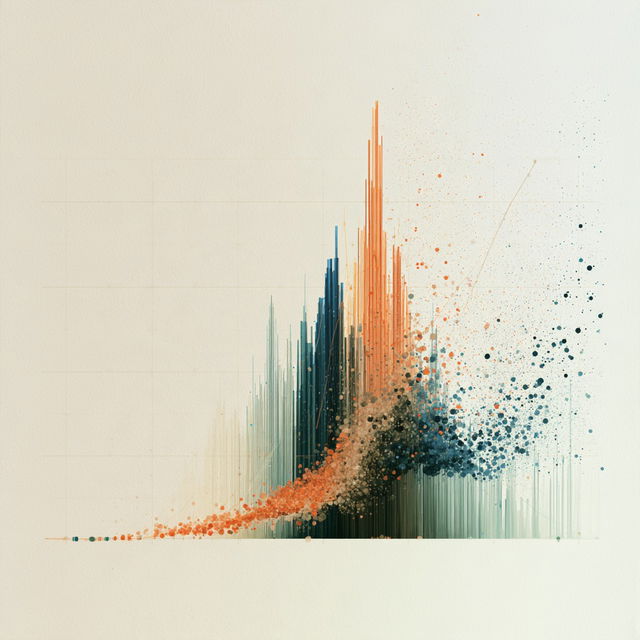
Across all four renders, the style combines abstract data-like geometry with dense fields of particles, fine connecting lines, grids, and sweeping arcs. It alternates dark, luminous presentations with pale chart-like grounds, using saturated orange, blue, teal, and magenta accents, strong negative space, and a sense of upward kinetic flow.
Look terms
Style qualityAbstract804Detailed8,113
SubjectPatterns1,250
Visual effectsGlow2,290Motion1,525
TechniqueFine lines2,687
Colour schemeHigh contrast5,516Vivid5,436
GenreSurreal3,262
CompositionGeometric2,386Negative space1,403
Colours
Earlier versions
Similar styles


SREF codes

SREF codes


SREF codes