Save and like styles with a free account. A membership adds notes and more room. See membership →
Copy the prompt or code, then paste it after your own words in Midjourney. How it works →
About
Thermograph is a device used to record temperature variations over time, often employed in scientific and industrial applications to monitor and analyze thermal changes. It provides a visual representation of temperature data, typically using a graph or chart format.
Observations
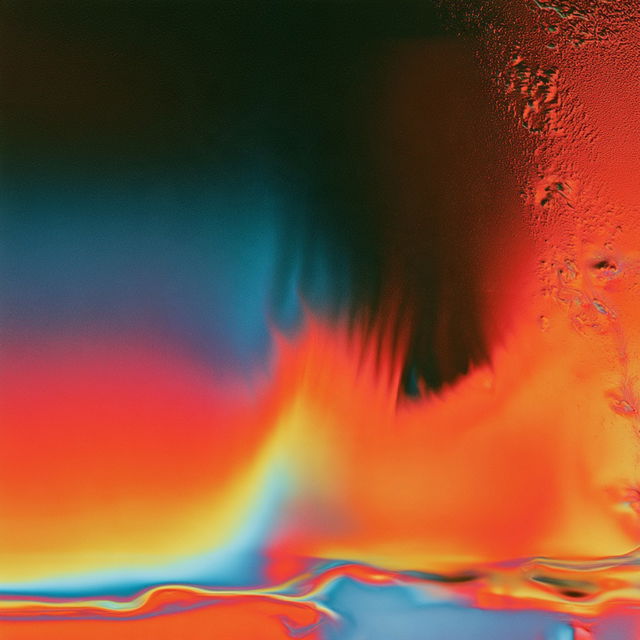
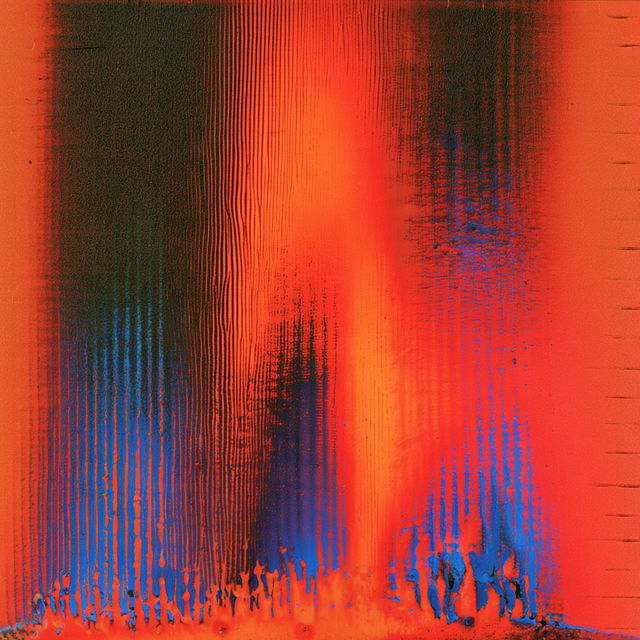
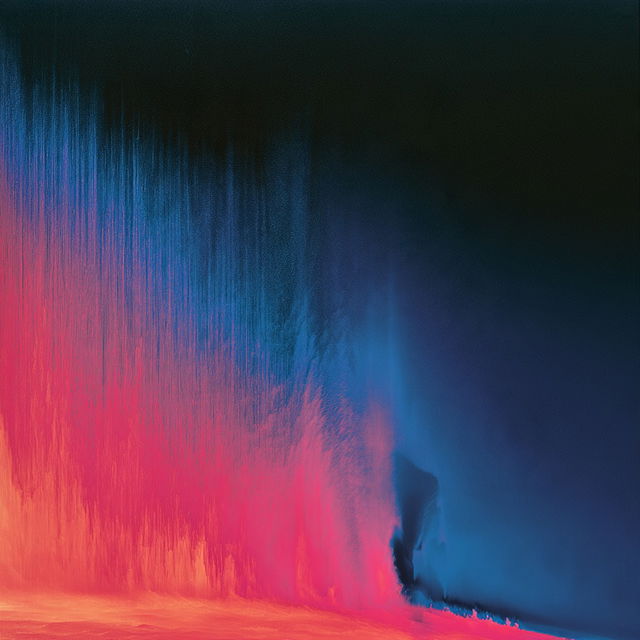
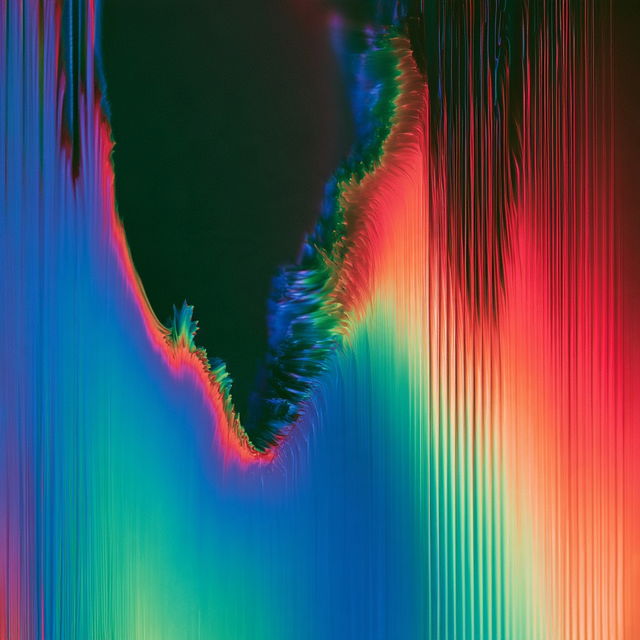
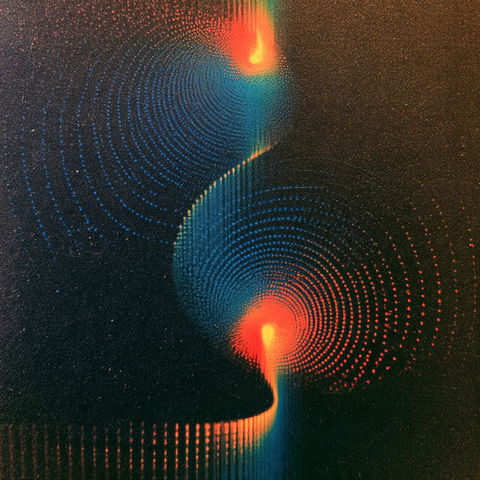
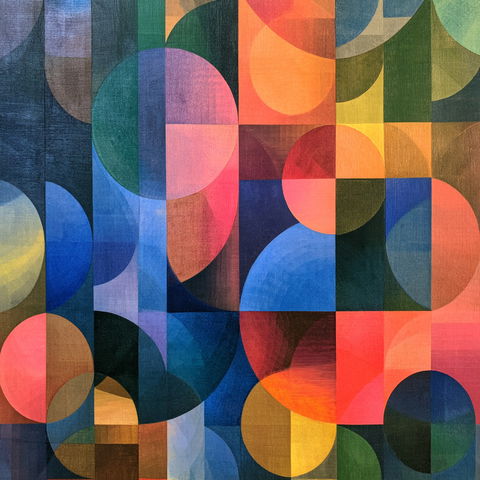
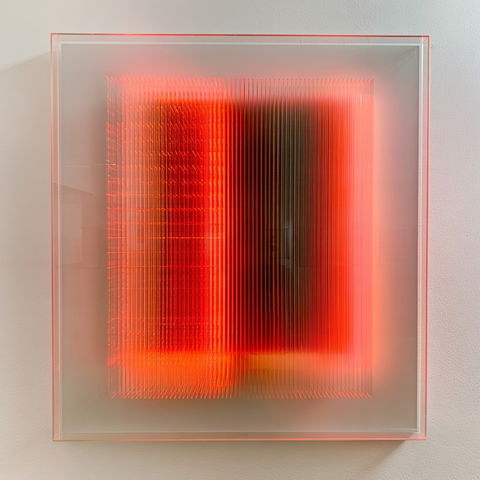
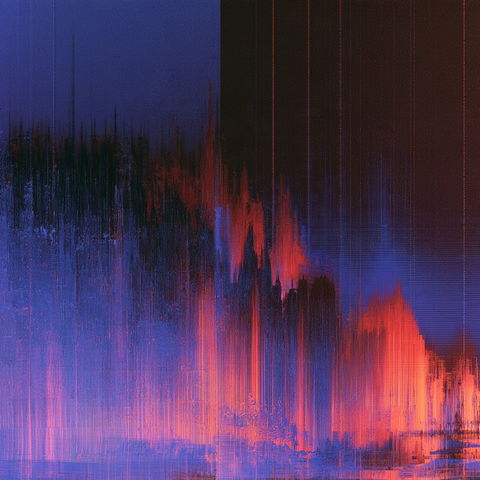
Across all four renders, the style is non-representational and intensely saturated, combining neon gradients with deep dark fields and sharp tonal separation. Repeated vertical scanlines, smeared color, distressed textures, and warped bands create a glitch-like, kinetic surface with surreal digital interference.
Look terms
Style qualityAbstract804Expressive3,403
SubjectPatterns1,250
Visual effectsGlow2,290
TechniqueFine lines2,687
Colour schemeHigh contrast5,516Vivid5,436
GenreSurreal3,262
CompositionGeometric2,386
Colours
Earlier versions
Featured in
Similar styles

Various
Techniques
SREF codes