Copy the prompt or code, then paste it after your own words in Midjourney. How it works →
About
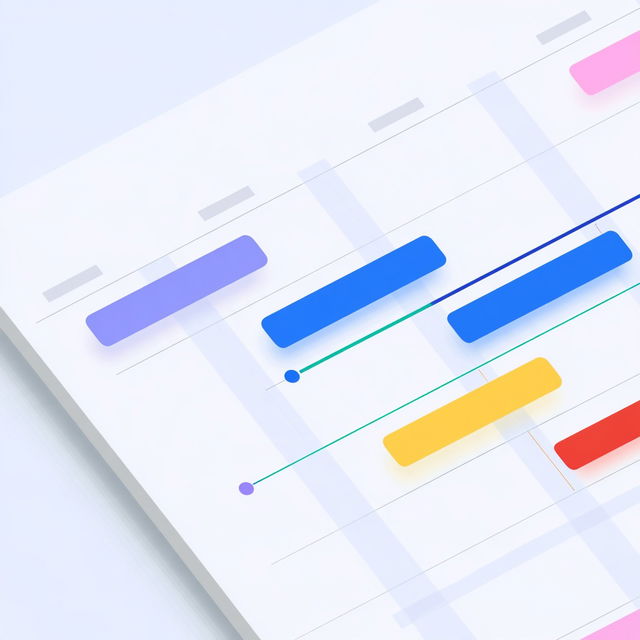
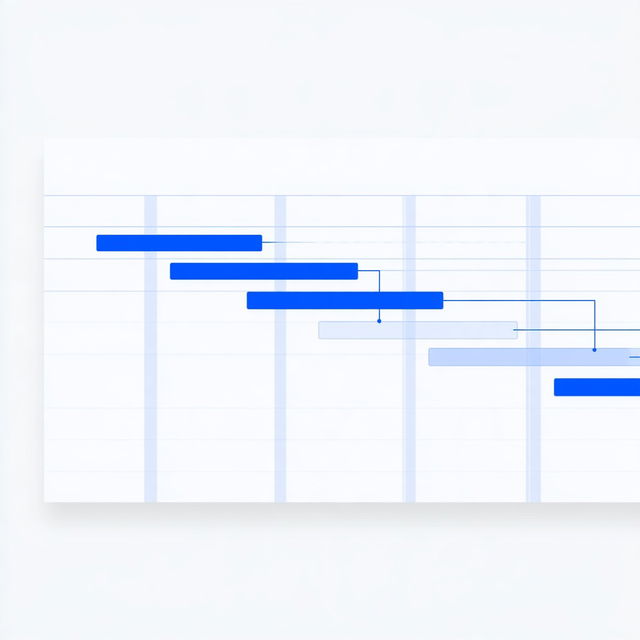
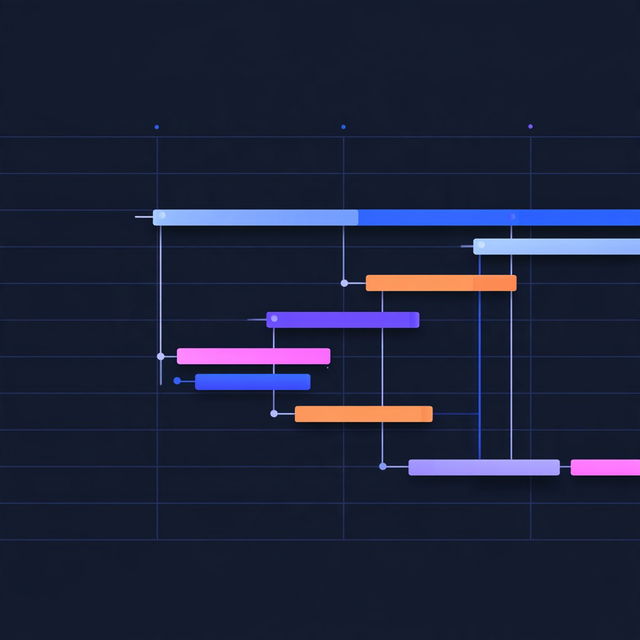
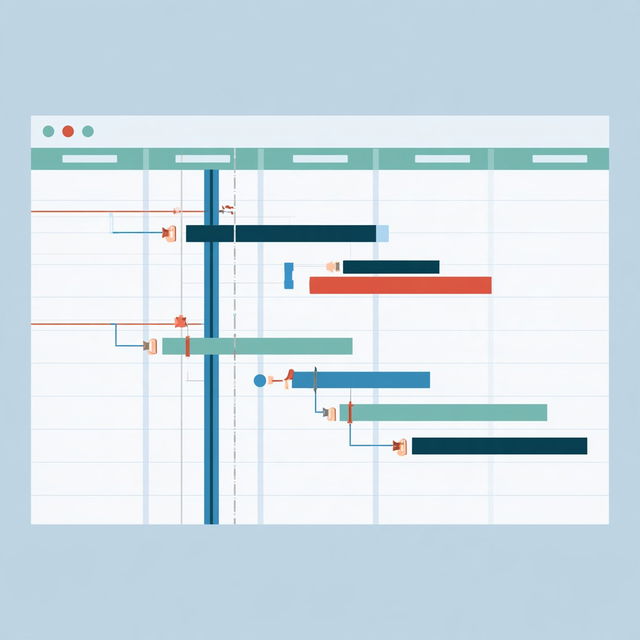
Gantt chart is a type of bar chart that illustrates a project schedule, showing the start and finish dates of the various elements of a project. It is commonly used in project management to provide a visual timeline for tasks and activities, helping to plan, coordinate, and track specific tasks within a project.
Observations
This style uses clean geometric layouts, flat color blocks, fine ruled lines, and structured grid systems to present abstract scheduling and workflow diagrams. Saturated blue, teal, pink, orange, and purple accents stand out against pale or dark technical backgrounds, with restrained glow and soft shadows adding subtle dimensionality.
Look terms
Style qualityAbstract804Detailed8,113Illustrative2,985
SubjectPatterns1,250
Visual effectsGlow2,290
TechniqueFine lines2,687Flat color2,068
Colour schemeHigh contrast5,516Vivid5,436
CompositionGeometric2,386